How to Create a Software Engineering Dashboard Using Keypup's Configuration Assistant

Create a software engineering dashboard in minutes using Keypup's configuration assistant. Build effective metrics and KPIs without data engineering skills. Monitor and optimize your team's performance, make informed decisions, and drive success with Keypup's user-friendly approach. Unlock the power of data-driven insights in your software engineering endeavors.

Celine Nabais
Celine Nabais LinkedIn
• 3 min read
How to Create a Software Engineering Dashboard Using Keypup's Configuration Assistant

Building effective engineering metrics and KPIs can be a daunting task, especially for those who are new to the process. Fortunately, Keypup's configuration assistant provides a user-friendly solution that enables users to quickly create software engineering dashboards without the need to delve into complex custom formulas or filters right away. This streamlined approach facilitates quick adoption and empowers users to get started with valuable insights in no time.

In this article, we will guide you through the process of creating a software engineering dashboard using Keypup's configuration assistant.

‍​

1. First, click on the "+ New dashboard" button located at the top of the left navigation panel.
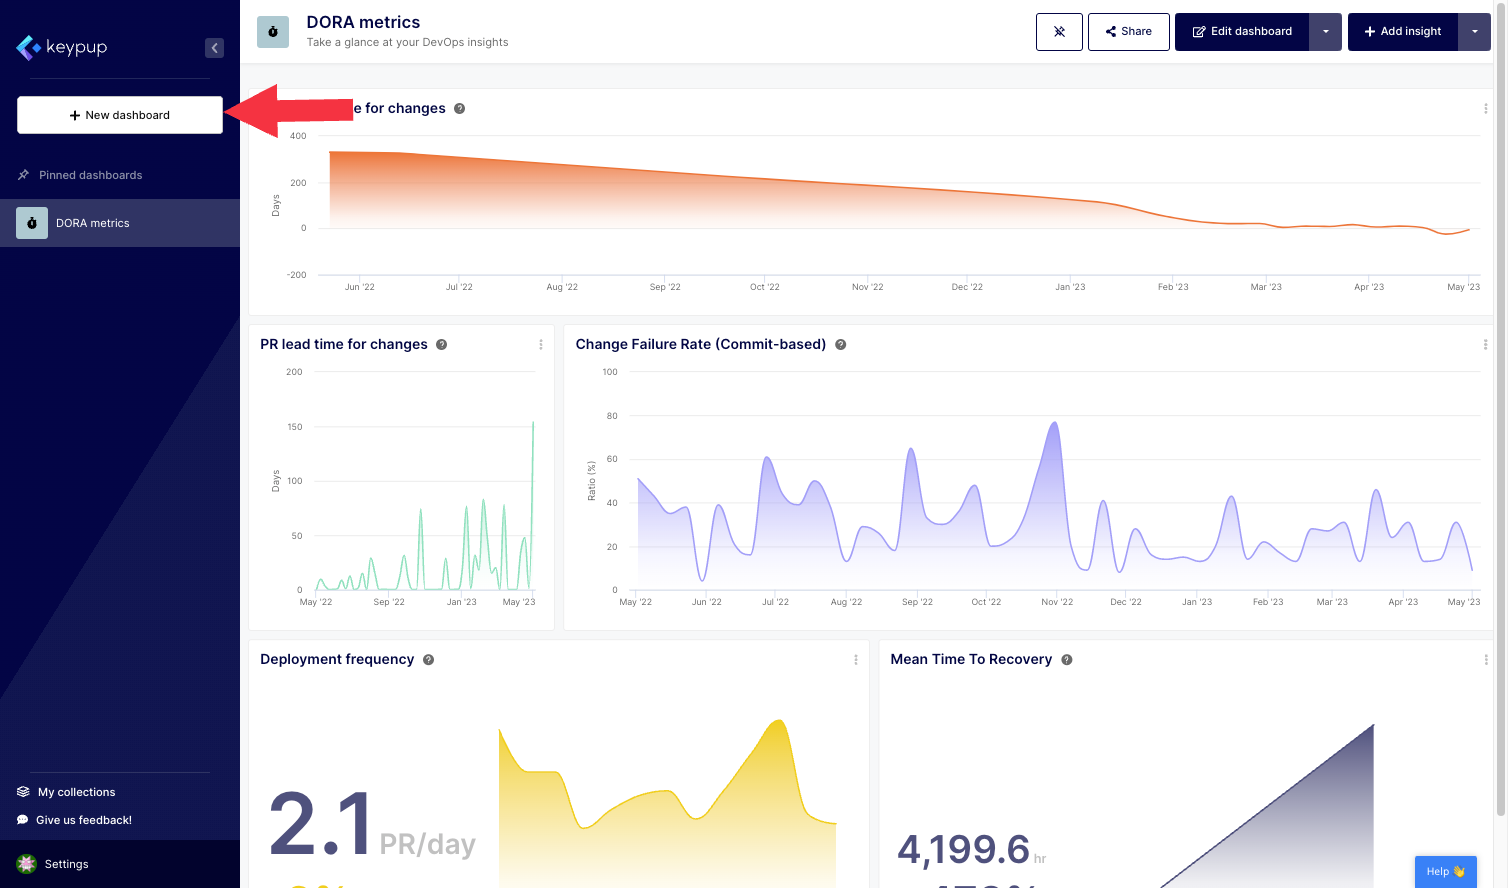
Image

2. From there, you can select a dashboard from a variety of templates or start with a blank dashboard. Click on the "Create new dashboard from template" located below the template of your choice. This example shows the Value stream management dashboard.
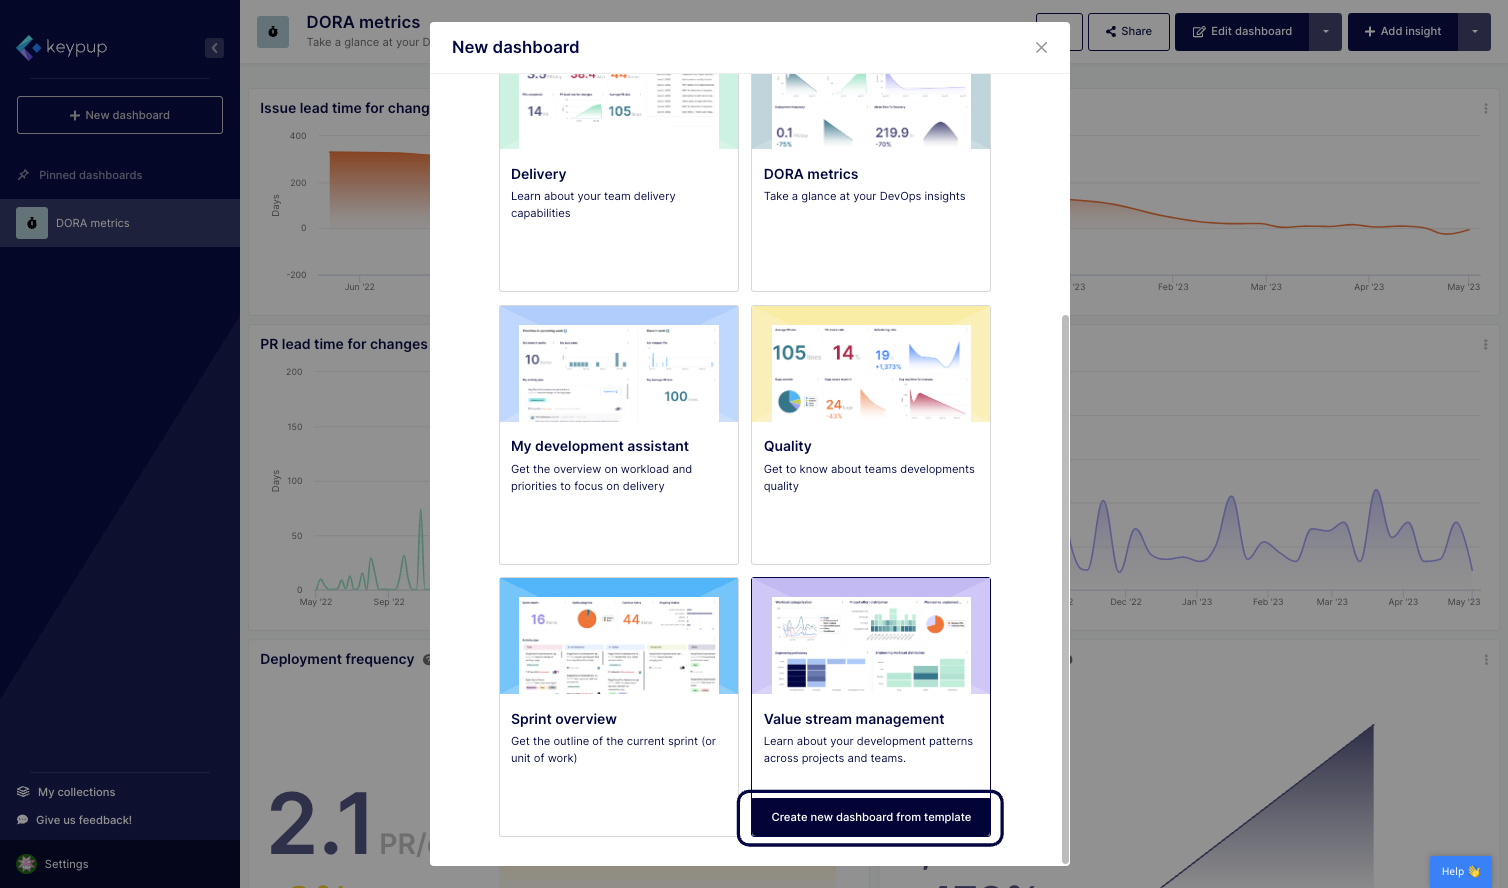
Image

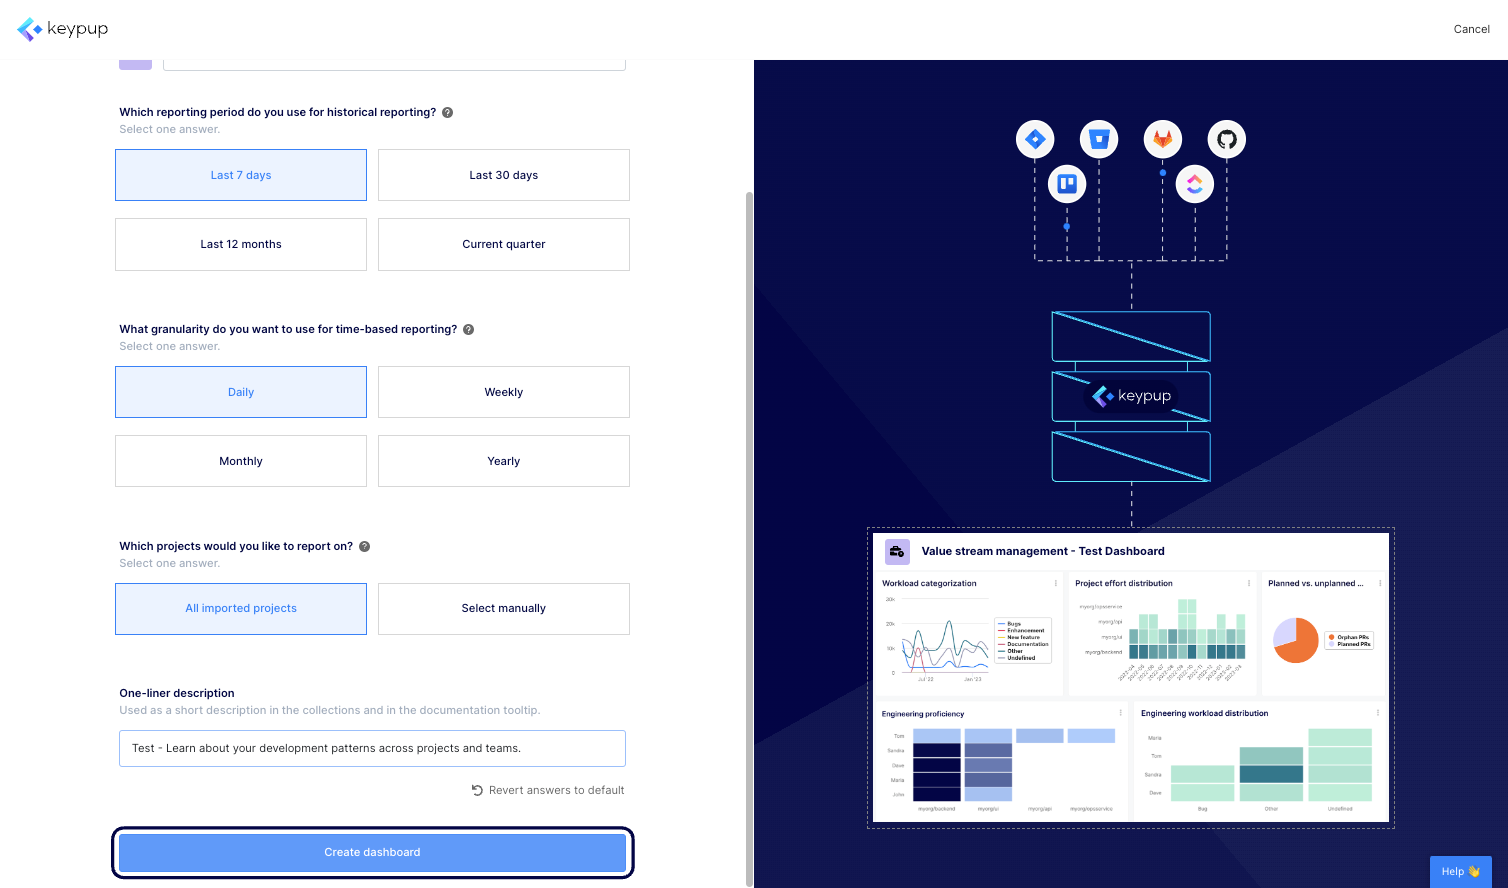
3. From this page, you can configure all the metrics contained in your dashboard by answering a few questions (such as time frame or project) and adjusting the title accordingly. The set of questions will vary based on the metrics contained in each dashboard template.
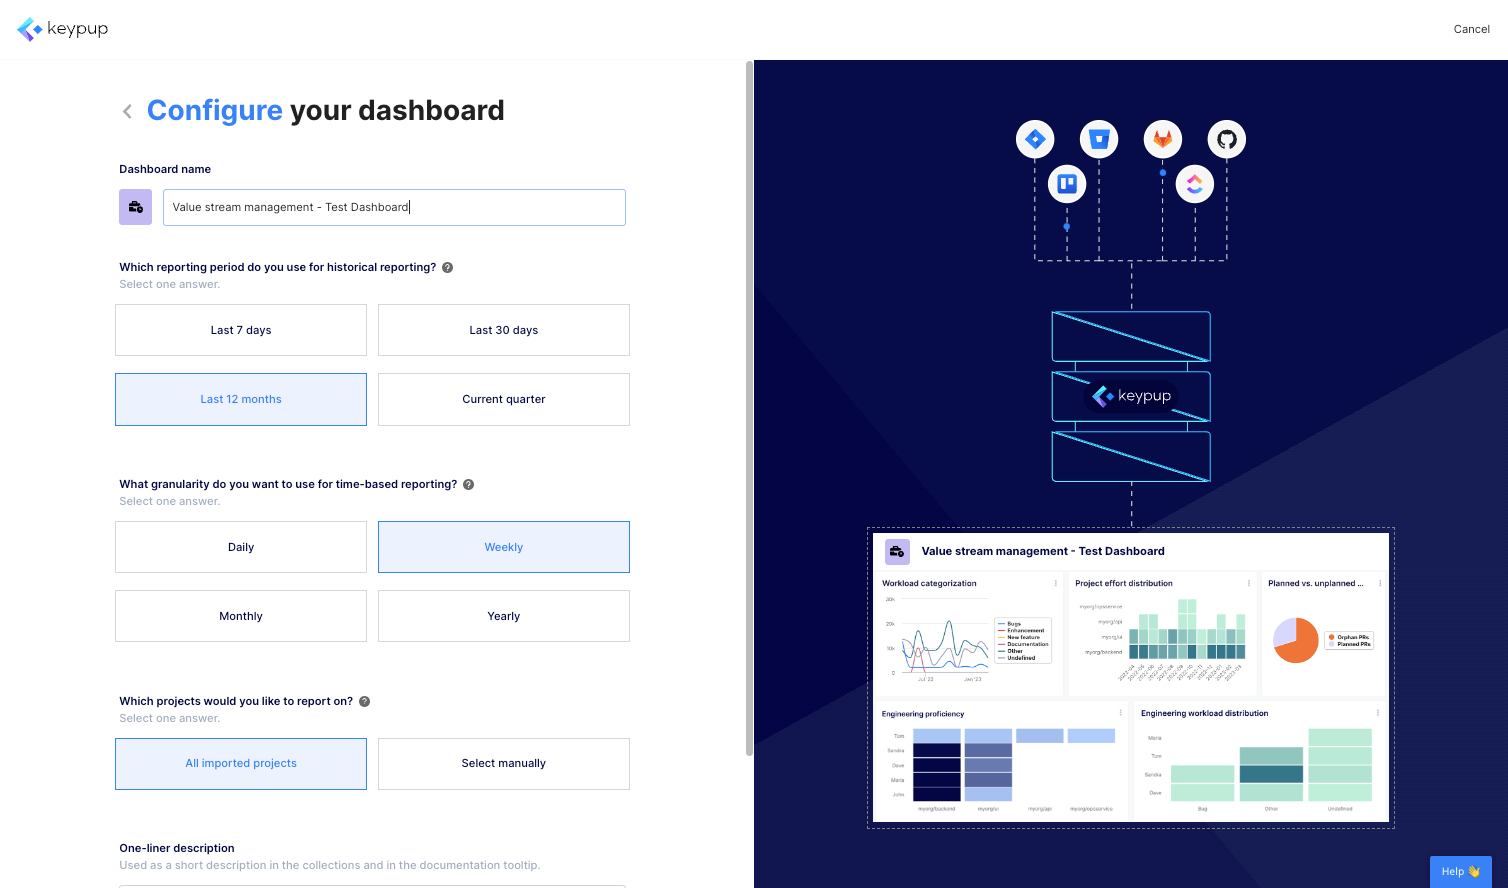
Image

4. Once done, click on the "Create dashboard" button located at the bottom of this screen.
Image

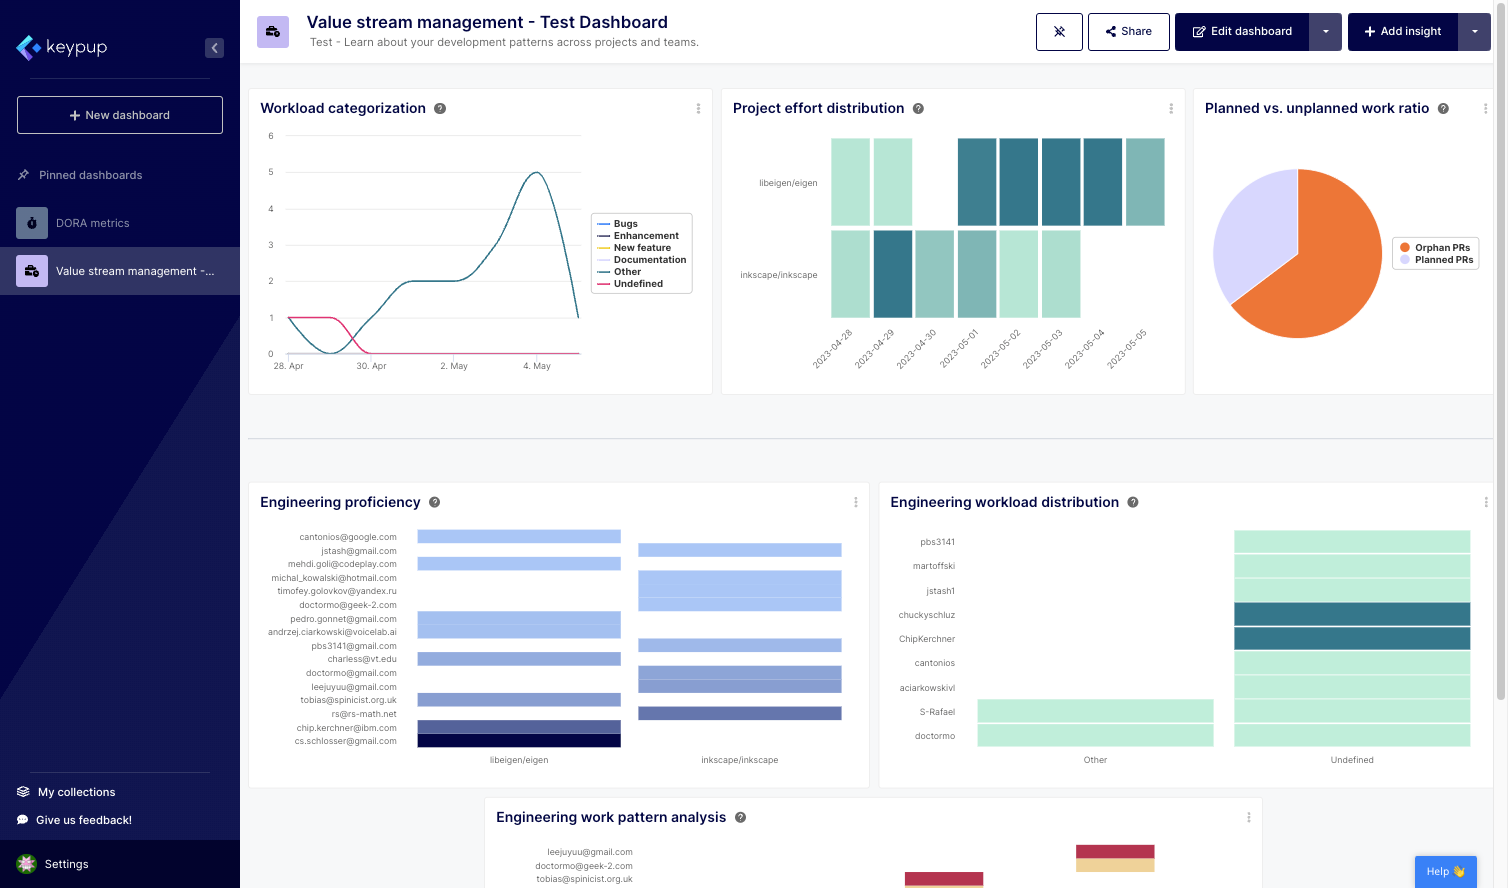
5. And that's it, your dashboard is now ready to explore and share.
Image

‍

Keypup's configuration assistant empowers users to leverage the power of data analytics without being overwhelmed by complex technicalities. With a user-friendly approach and guided configuration process, teams can quickly adopt Keypup's platform and start harnessing the benefits of software engineering dashboards.

Now that you have the knowledge and tools to create your own software engineering dashboard, you can effectively monitor and optimize your team's performance, identify areas for improvement, and make informed decisions that drive success.

Take advantage of Keypup's configuration assistant today, and unlock the full potential of your software engineering metrics. By embracing data-driven insights, you can enhance collaboration, improve productivity, and propel your organization toward greater achievements.


Ready to Transform Your Analytics?

Join teams already using AI to make data-driven decisions faster than ever.

Most Recent Articles

6 Best Engineering Metrics Software for Fast Setup (2026)

6 Best Engineering Metrics Software for Fast Setup (2026)

Compare the 6 best engineering metrics software for fast setup in 2026 — Keypup, LinearB, Swarmia, Jellyfish, Faros and Harness SEI — across setup speed, integration overhead, dashboard flexibility, delivery metrics coverage, AI capabilities and data security. Find out which platform gets a mid-market engineering team from connecting Git and Jira to actionable delivery metrics in minutes, not months.

Thomas Williams
Release Notes Fiction: Why Your Jira Fix Version Doesn't Match What Actually Shipped

Release Notes Fiction: Why Your Jira Fix Version Doesn't Match What Actually Shipped

Your release notes list 9,860 changes. Only 71% had merged code by the release date, and a quarter of the merged code is listed nowhere. Learn what engineering leaders on Reddit say about Jira Fix Versions, release scope and untracked changes at enterprise scale, and how Keypup MCP reconciles each version's scope with linked, merged pull requests.

Arnaud Lachaume
The Bug SLA Mirage: Why Priority Fix Targets Are Missed and Nobody Knows

The Bug SLA Mirage: Why Priority Fix Targets Are Missed and Nobody Knows

Your bug SLA report says 91%. Your customers experienced 65%. Learn what engineering leaders on Reddit say about P1 fix-time targets, SLA clocks that start late and bugs closed to stop the timer at enterprise scale, and how Keypup MCP measures real SLA attainment by priority and team from Jira workflow history and linked pull requests.

Thomas Williams